Engineer the plan. A detailed, metered study that breaks your consumption down by end-use and turns it into a costed, prioritised roadmap of efficiency measures — with real savings, capital and returns.
Blueprint puts real instrumentation on your plant. We meter and log the major systems over time, break energy down by end-use, and engineer a specific set of measures — each with quantified savings, cost and payback — so you can decide what to do, in what order.
Metered data gathering — interval metering, sub-metering and Athar sensors log real load profiles.
End-use breakdown — where energy and waste actually go, system by system.
Engineered measures — specific interventions across cooling, heat, compressed air and process.
Savings, cost & payback — quantified per measure, with a prioritised implementation order.
Waste streams metered & tracked — water, waste heat, organics, recyclables and general waste, quantified over time.
Carbon reporting — a Scope 1, 2 & material Scope 3 inventory, structured for UAE emissions reporting.
What you walk away with
A costed plan you can act on.
Measured end-use energy model
Measured waste & resource baseline
Package of engineered measures
Savings, capex & payback per measure
Prioritised roadmap + outline measurement plan
Reportable carbon footprint — Scope 1, 2 & 3
The bridge between "we should save energy and reduce waste" and "here's exactly how, what it's worth, and how we report our emissions to the authorities with a reduction plan in place."
The Athar edge
Real data, not rules of thumb.
Because Athar deploys its own sensing and cloud analytics, Blueprint is built on your plant's actual behaviour across load, weather and operating hours — so the savings numbers hold up when it's time to invest.
Our own data collection
The instruments we deploy.
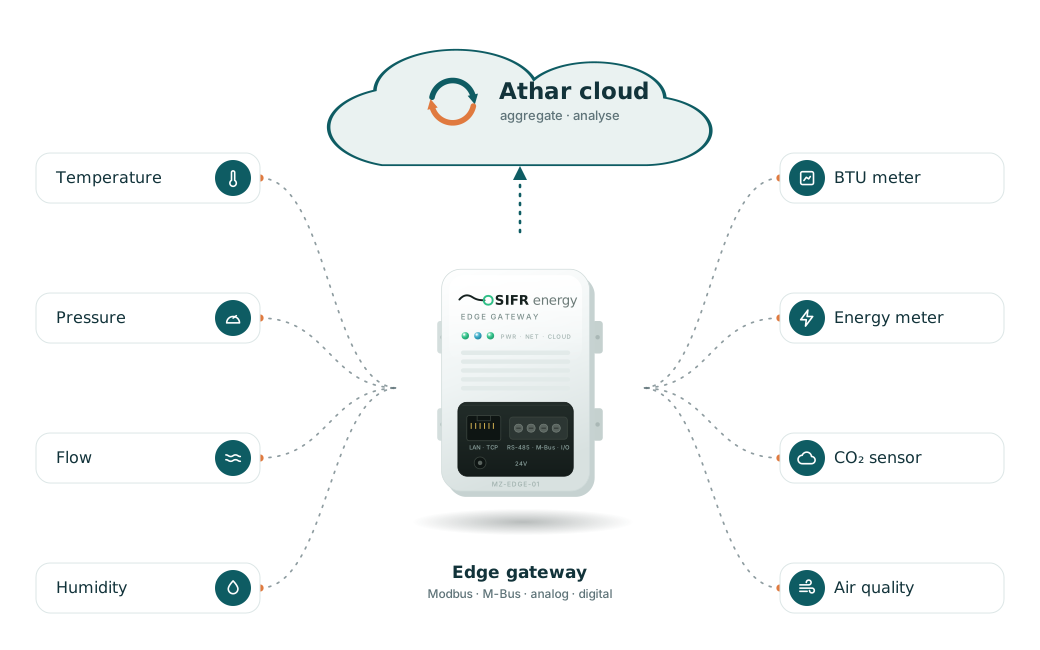
Blueprint isn’t a clipboard exercise. Athar temporarily installs its own ecosystem of meters and sensors — all feeding the Sifr edge gateway and our cloud — so every figure comes from your plant’s real behaviour, not assumptions or nameplate data.
Plus vibration, power-quality, ambient-weather & process-specific sensors — added per site
What you get
Your plant, in engineered numbers.
Blueprint turns metered data into dashboards, charts and an engineered report — headline metrics, end-use breakdowns, measured asset performance, and a costed, prioritised set of opportunities. A sample of the output below.
athar.cloud / report · sample facility
4.2 GWh/yr
Energy consumed
1.9M TR·h
Cooling delivered
780 MWh/yr
Recoverable waste heat
42,000 m³/yr
Water & wastewater
0.78 kW/ton
Plant efficiency
63%
Waste divertible from landfill
1,850 tCO₂/yr
Carbon footprint
AED 1.2M /yr
Identified savings
Energy consumption — last 12 months (MWh/mo)−18% vs last year
Energy by end-use
Waste streams — where it goes (share by weight)
Water & wastewater 26%
Waste heat 16%
Organic 20%
Plastics & recyclables 14%
Paper & card 10%
General 14%
Measured asset performance — against good-practice benchmarks
Asset
Observed
Good practice
Status
Chiller 1 · air-cooled
COP 1.2
≥ 1.9
Underperforming
Chiller 2 · air-cooled
COP 1.5
≥ 1.9
Underperforming
Chilled-water pump set
34% eff.
≥ 65%
Underperforming
Cooling-tower approach
4.2 °C
< 2.0 °C
Watch
Compressed-air leakage
18%
< 10%
Action
Identified opportunities — quantified per measure, prioritised for investment
Illustrative sample output for a mid-size facility — your Athar report shows your actual measured figures, benchmarks and tracked trends.
Your reportable footprint
A full, reportable GHG inventory.
At Blueprint, the metered data becomes a complete greenhouse-gas inventory — Scope 1, 2 and material Scope 3 — calculated to recognised standards (the GHG Protocol) and structured for UAE emissions reporting. Every reduction measure we engineer is quantified in both dirhams saved and CO₂e cut.
Scope 1, 2 & material Scope 3 inventory — a verifiable CO₂e footprint to GHG-Protocol method.
Carbon tied to every measure — each engineered option shows the savings and the CO₂e it removes.
A report structured for UAE reporting — organised the way regulators expect.
Structured for emissions reporting under UAE Federal Decree-Law No. 11 of 2024 — a credible inventory you can build your disclosures on. The engineered savings and ROI still lead the business case; the report comes with them.
Carbon at Blueprint
Verifiable & reportable.
A defensible inventory you can put in front of regulators — paired with a reduction roadmap that cuts cost and carbon together.